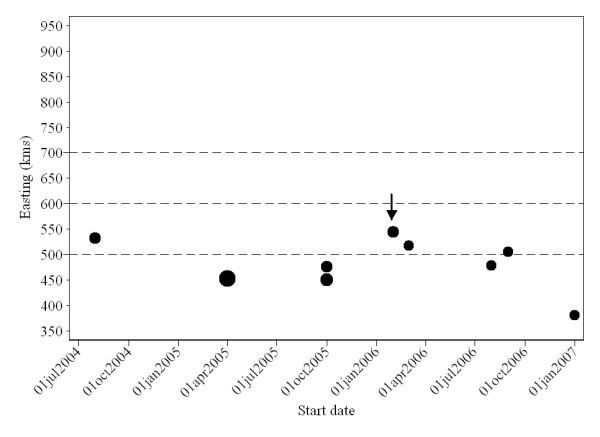
Figure 11.

Scatterplot of all reported spatio-temporal clusters of reported PCVAD cases identified by a space-time permutation model in the study area between January 2004 and April 2007. The y axis represents easting of the cluster centroid, and the x axis represents the start date. Size of dots is proportional to cluster size. Gridlines represent categorization of the study area in four different zones with respect to easting, in agreement with classification of zones in Figure 5. The most likely cluster is identified by arrow.
