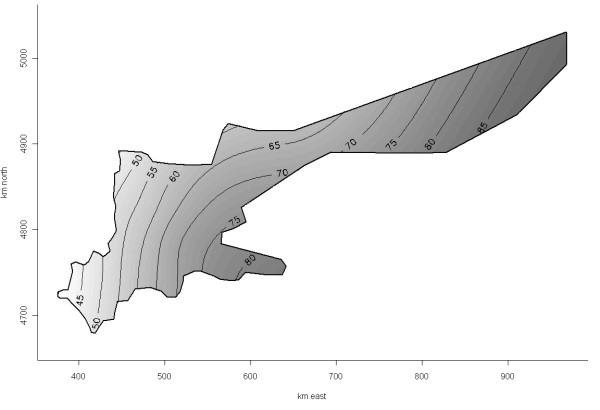
Figure 3.
Expected risk (probability) of PCVAD in the Ontario study population containing 278 herds based on a generalized additive model with a smooth bivariate term for herd locations as the only covariate (Ps(x, y) = 0.16). The map shows a relatively simple trend with decreasing risk in the western direction. Note that probabilities depicted on isolines should not be interpreted as prevalence or a risk in the entire population, as it was in part influenced by complex data inclusion mechanism.

