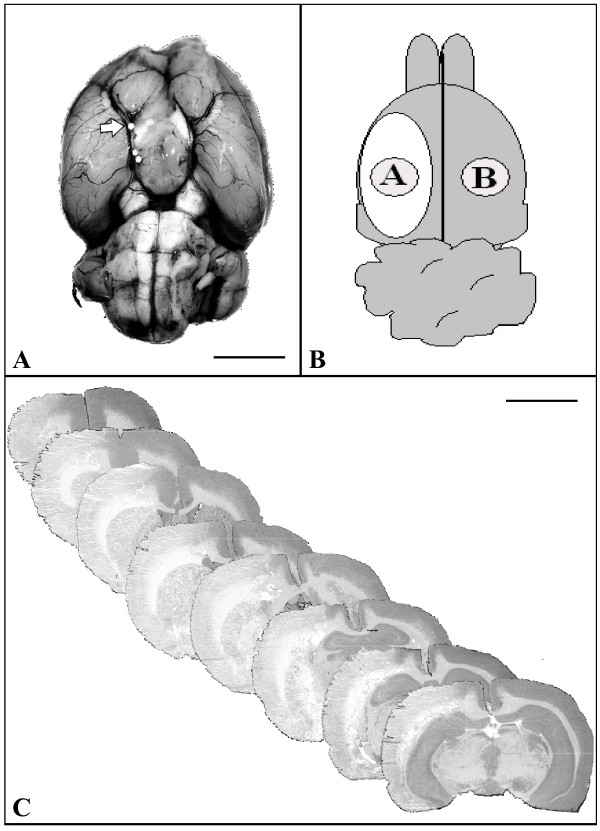
Figure 1.
Characterization of the macrosphere stroke model. (A) Basal view of the rat brain displaying the cerebral arteries following macrosphere-injection into the MCA. One macrosphere is located in the origin of the MCA and the distal ICA (arrow). Bar: 5000 μm. (B) Schematic drawing of the rat brain (dorsal view) to localize tissue samples collected from the ischemic lesion [A] and contralateral cortex [B]. (C) Representative H&E staining of coronal brain sections demonstrating the extent of the ischemic lesion 7 days after ischemia induction. Objective 1×; bar: 5000 μm.

