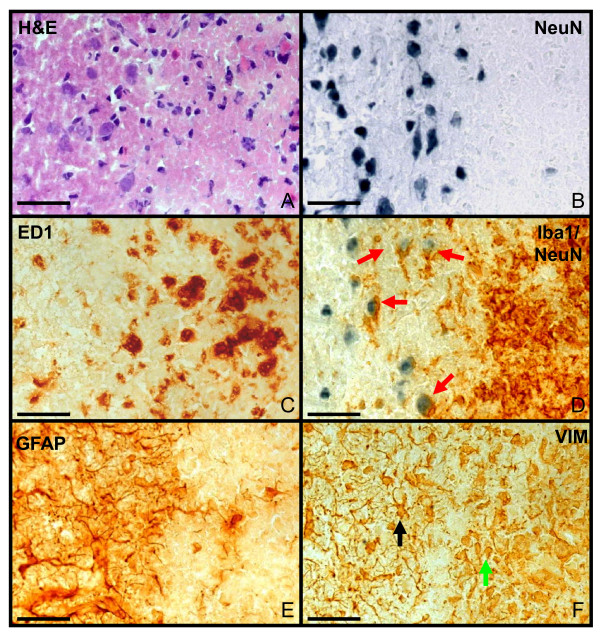
Figure 4.
Cellular interaction in the infarct demarcation zone. Infarct demarcation zone at day 7 after infarct induction (left: healthy tissue; right: infarct zone) with different stainings: H&E (A), NeuN (B), ED1 (C), anti NeuN antibody and anti-Iba1 antibody (D), GFAP (E) and VIM (F). The infarct zone was clearly demarcated (A-F) Eosinophilic coagulation (A) and neuronal degeneration (B) occurred at the infarct. ED1+ phagocytes (C) and activated microglia (D, brown) are visible within the infarct. Interactions between neurons and activated microglia occurred (D, red arrows). GFAP-positive astrocytes (E) demarcate the lesion forming an astrocytic scar in the vital tissue adjacent to the infarct border. Vimentin immunoreactivity (F) depicts proliferating astrocytes within the scar (black arrow) as well as other cell types within the infarct (green arrow). Objective: 40×; bar: 50 μm.

