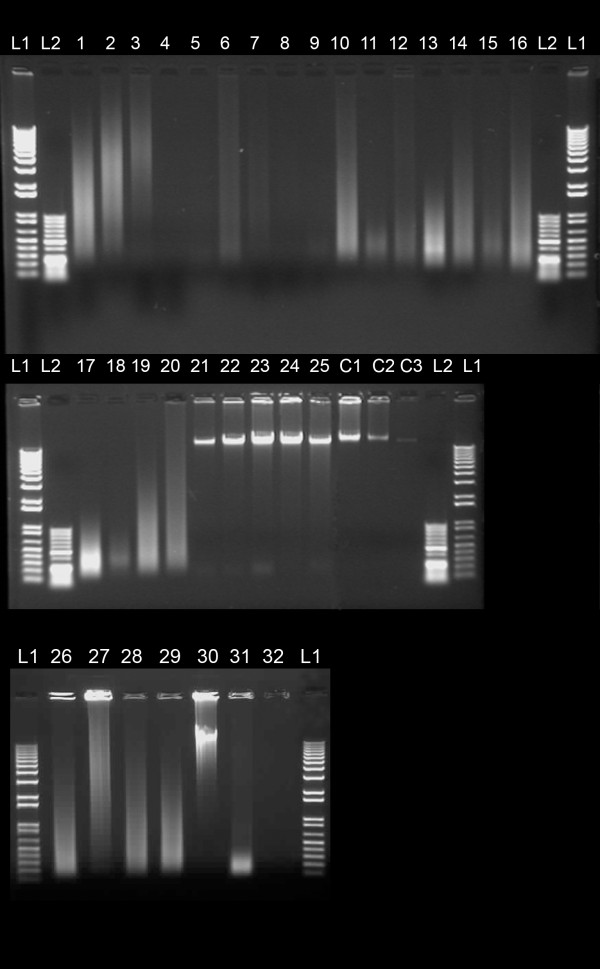
Figure 1.
Quality and quantity assessment of DNA samples: Image of a 1% agarose gel separation after ethidium bromide staining depicting several representative tumour samples for testing. L1 and L2 represent 1 kb+ and 50 bp ladders, respectively. C1, C2, C3 are high molecular weight genomic DNA samples with known concentrations of 500, 250 and 50 ng, respectively. Detailed sample characteristics are provided in Table 2.

