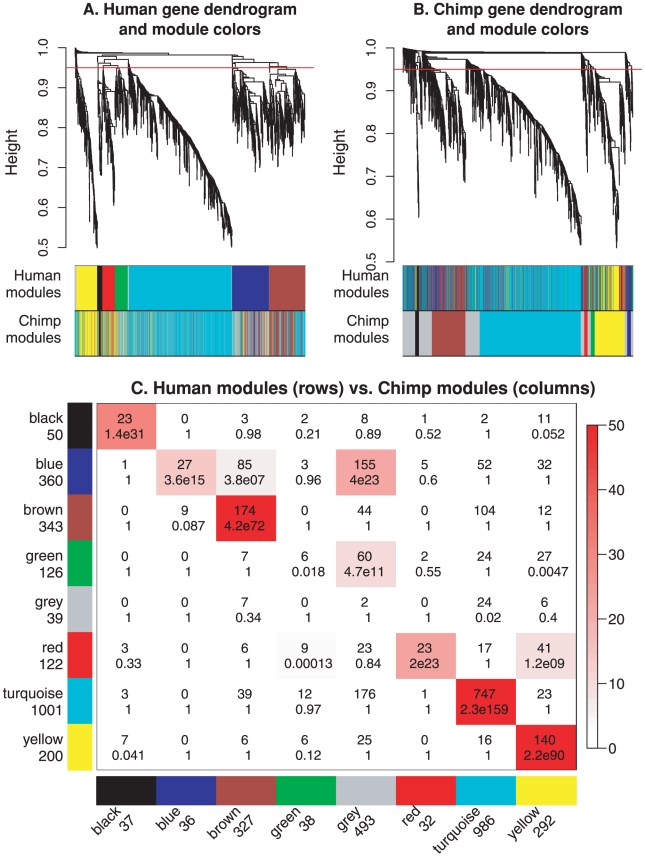
Figure 3. Cross-tabulation based comparison of modules (defined as clusters) in human and chimpanzee brain networks.
A. Hierarchical clustering tree (dendrogram) of genes based on human brain co-expression network. Each “leaf” (short vertical line) corresponds to one gene. The color rows below the dendrogram indicate module membership in the human modules (defined by cutting branches of this dendrogram at the red line) and in the chimpanzee network (defined by branch cutting the dendrogram in panel B.) The color rows show that most human and chimpanzee modules overlap (for example, the turquoise module). B. Hierarchical clustering tree of genes based on the chimpanzee co-expression network. The color rows below the dendrogram indicate module membership in the human modules (defined by cutting branches of dendrogram in panel A.) and in the chimpanzee network (defined by branch cutting the dendrogram in this panel.) C. Cross-tabulation of human modules (rows) and chimpanzee modules (columns). Each row and column is labeled by the corresponding module color and the total number of genes in the module. In the table, numbers give counts of genes in the intersection of the corresponding row and column module. The table is color-coded by  , the Fisher exact test p value, according to the color legend on the right. Note that the human yellow network is highly preserved while the human blue network is only weakly preserved in the chimpanzee network.

