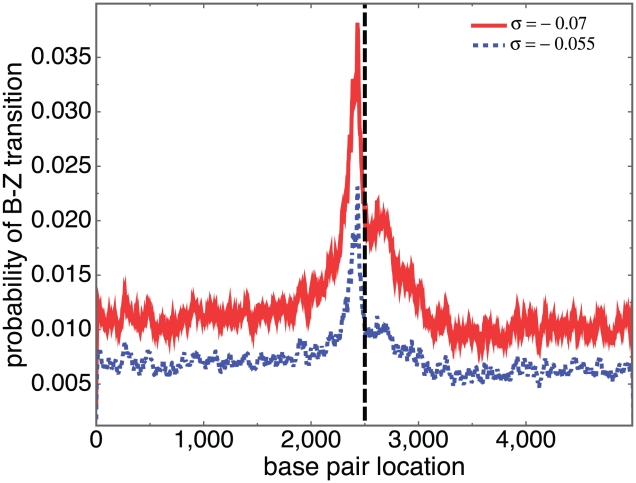
Figure 6. The average probability of B-Z transition is plotted as a function of base pair location, the average being taken over 12,841 mouse genes.
The sequences were aligned so their TSSs are all located at position 2500, indicated by the vertical dashed line. The solid and dotted lines are the results for  −0.07 and −0.055, respectively.

