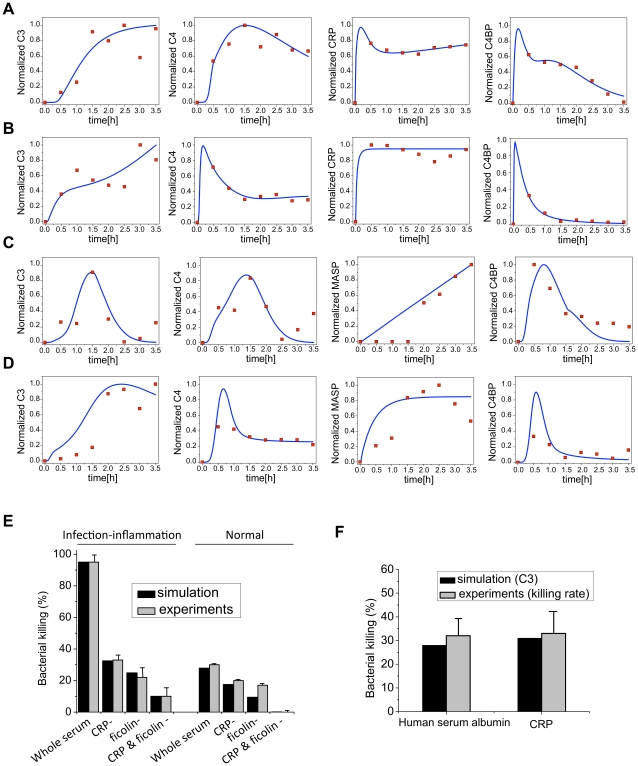
Figure 2. Model predictions and experimental validation.
(A–D) Experimental and simulated dynamics of the complement pathway. The time profiles of deposited C3, C4, MASP-2, CRP and C4BP under the following four conditions are simulated using estimated parameters and compared against the experimental data: (A) PC-initiated complement activation under inflammation condition, (B) PC-initiated complement activation under normal condition. (C) GlcNAc-initiated complement activation under inflammation condition; (D) GlcNAc-initiated complement activation under normal condition. Blue solid lines depict the simulation results and red dots indicate experimental data. (E–F) Model predictions and experimental validation of effects of the crosstalk. (E) Simulation results (black bar) of end-point bacterial killing rate in whole serum, CRP depleted serum (CRP-), ficolin-depleted serum (ficolin-), both CRP- and ficolin-depleted serum (CRP- & ficolin-) under normal and infection-inflammation conditions agree with the previous experimental observations (gray bar). (F) The simulated bacterial killing effect of high CRP level agrees with the experimental data.

