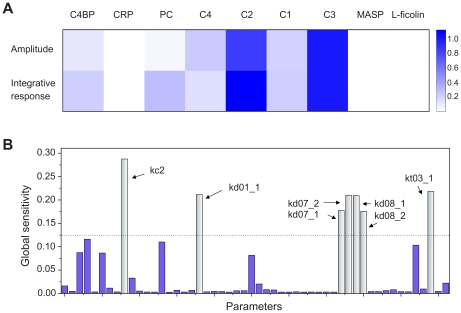
Figure 3. Sensitivity analysis.
(A) Local sensitivities were calculated as the control coefficients of the initial protein concentrations for amplitude and integrated response of C3 deposition. (B) Global sensitivities were calculated according to the MPSA method. The most sensitive parameters are colored in light blue. kc2 refers to the association rate of C3b with the surface. kd01_1 refers to the association rate of CRP and ficolin. kd07_1 and kd_07_2 are the Michaelis-Menten constants governing the cleavage rate of C2. kd08_1 and kd_08_2 are the Michaelis-Menten constants governing the cleavage rate of C4. kt03_1 refers to the decay rate of C4bC2a. Those reactions are colored in red in Figure 1B .

