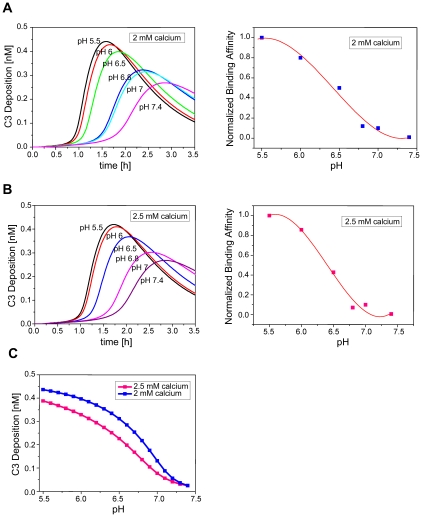
Figure 4. Simulation of antibacterial response with different pH and calcium level.
(A) The deposited C3 time profile at pH ranging from 5.5 to 7.4, in the presence of 2 mM calcium. (B) The deposited C3 time profile at pH ranging from 5.5 to 7.4, in the presence of 2.5 mM calcium. In the right panels of (A) and (B), dots denote the normalized binding affinities of CRP and L-ficolin reported previously [15]. Curves represent the estimated functions used for predicting. (C) The pH-antibacterial response curves of complement activation in the presence of 2 mM calcium (pink) or 2.5 mM calcium (blue).

