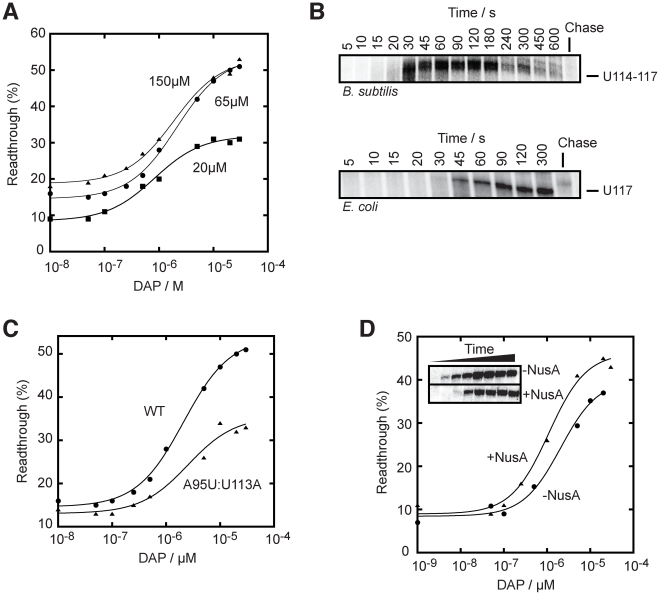
Figure 5. The rate of transcription is important for the pbuE riboswitch activity.
(A) Single-round in vitro transcriptions were performed using either 20 µM (squares), 65 µM (circles) or 150 µM (triangles) rNTP. T50 values of 0.8±0.1 µM, 2.1±0.2 µM and 1.9±0.3 µM were obtained for reactions using 20 µM, 65 µM and 150 µM rNTP, respectively. (B) Single-round transcription kinetics were performed and stopped at various time intervals. The complete gel is shown in Figure S5. Top, transcription time course showing a pausing site in the region U114–U117 that is observed when using the B. subtilis RNAP. Bottom, transcription time course performed with the E. coli RNAP also reveals a pausing site at position U117. Chase reactions were performed using 150 µM rNTP. (C) Single-round transcriptions using an A95U:U113A mutant that disrupts the riboswitch regulation. A T50 value of 2.6±0.1 µM was calculated. The readthrough efficiency is also significantly decreased in the context of the mutant (triangles). (D) Single-round experiments were performed in absence (circles) and in presence (triangles) of 1 µM NusA. T50 values of 2.1±0.7 µM and 1.1±0.3 µM were obtained in absence and in presence of NusA, respectively. The insert shows transcription kinetics done for 5, 10, 15, 20, 30, 45, 60 and 300 s in absence and in presence of 1 µM NusA. It can be observed that the presence of NusA delays the appearance of the full length species (15 s to 20 s), consistent with its role in slowing down transcription.

