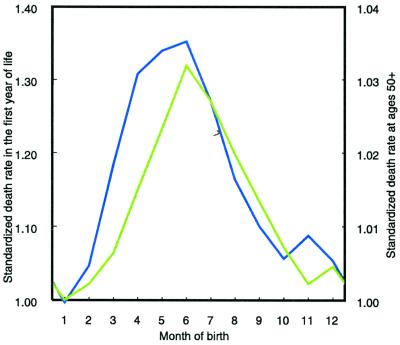
Figure 4.
Standardized death rates of Danish infants born in a specific month (green line) compared with standardized death rates at ages 50+ by month of birth (blue line). The standardized death rates are estimated by applying Eqs. 3 and 4. The mortality of those born in January is taken as the reference mortality (relative deviation = 1).

