
Figure 1.
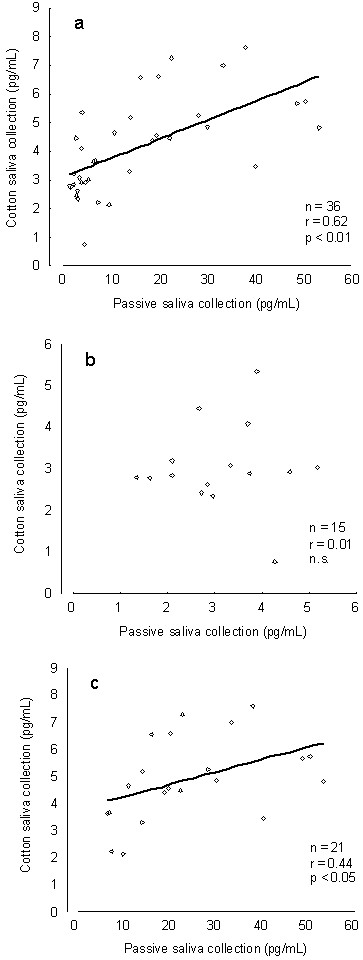
Scatter plots of melatonin concentrations between passive and cotton saliva collection for all (a), lower-level (b), and higher-level (c) samples.
Official websites use .gov
A
.gov website belongs to an official
government organization in the United States.
Secure .gov websites use HTTPS
A lock (
) or https:// means you've safely
connected to the .gov website. Share sensitive
information only on official, secure websites.
Scatter plots of melatonin concentrations between passive and cotton saliva collection for all (a), lower-level (b), and higher-level (c) samples.