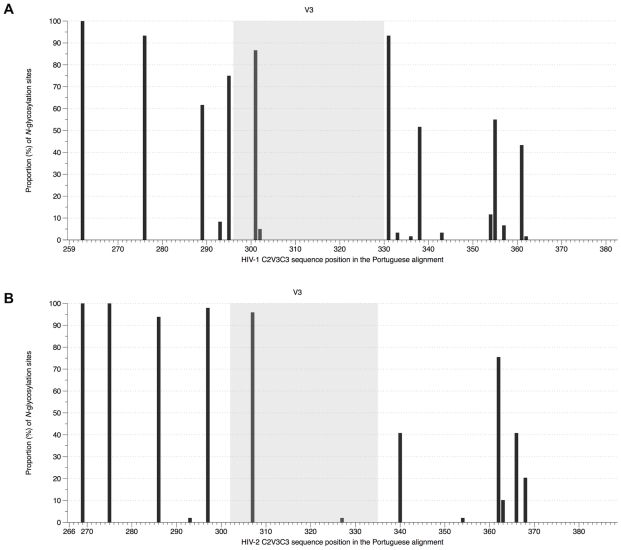
Figure 2. Frequency of N-glycosylation sites in the C2, V3 and C3 envelope regions in HIV-1 and HIV-2.
(A) HIV-1 alignment (PT dataset), sites were numbered according to codon env position of HIV-1 HXB2 reference strain; (B) HIV-2 alignment (PT dataset), sites were numbered according to codon env position of HIV-2 ALI reference strain.

