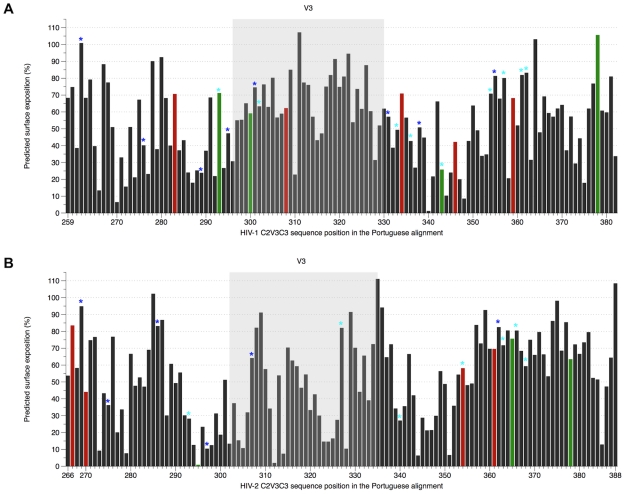
Figure 5. Solvent accessible surface area, positive selection and potential N-glycosylation sites in C2-V3-C3 region.
(A) HIV-1 alignment (PT dataset), sites were numbered according to codon env position of HIV-1 HXB2 reference strain; (B) HIV-2 alignment (PT dataset), sites were numbered according to codon env position of HIV-2 ALI reference strain. Coloured bars represent the amino acids under positive selection and have the same colours (red and green) as the corresponding positions (balls) highlighted in Figure 4A. The dark blue stars over the bars correspond to potential N-glycosylation sites conserved along the alignment (present in ≥50% of strains), whereas the light blue stars represent sites only present in less than 50% of sequences.

