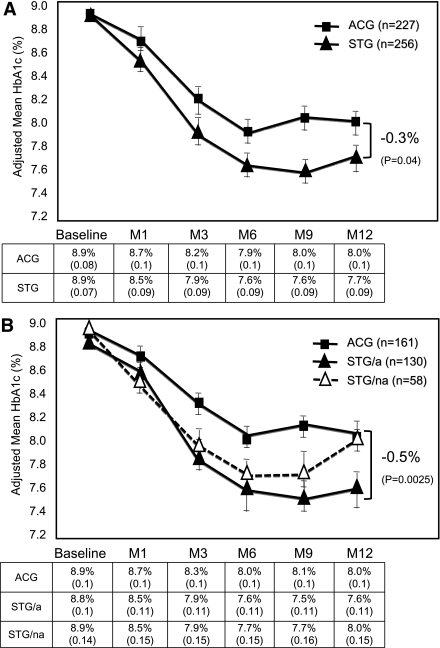
Figure 2.
A: ITT analysis: mean (± SE) A1C over 12 months (M) in patients with noninsulin-treated type 2 diabetes according to randomization group.B: PP analysis: mean (± SE) A1C over 12 months (M) in patients with noninsulin-treated type 2 diabetes, comparing ACG patients, adherent STG (STG/a) patients, and nonadherent STG (STG/na) patients.

