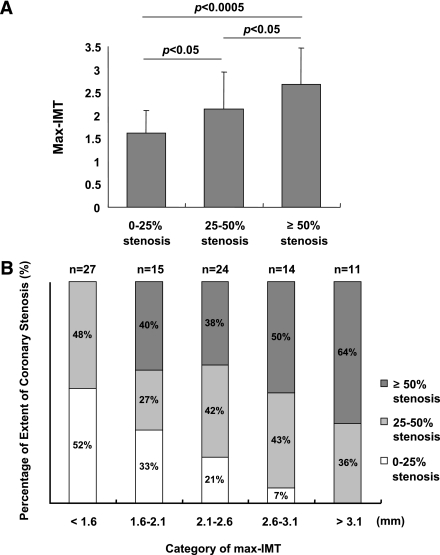
Figure 1.
A: The relationship between CIMT and coronary stenosis. Max-IMT was significantly greater in the ≥50% stenosis group (2.68 ± 0.77 mm) than the 0–25% stenosis group (1.61 ± 0.49 mm) (P < 0.0005) and the 25–50% stenosis group (2.14 ± 0.81 mm) (P < 0.05). In addition, the max-IMT of the 25–50% stenosis group was significantly greater than the 0–25% stenosis group (P < 0.05). B: The extent of coronary stenosis in each max-IMT category. In the max-IMT <1.6 mm group, the percentage of ≥50% stenosis was 0%, whereas in the patients whose max-IMT was ≥1.6 mm, the percentage of ≥50% stenosis was 45%. Furthermore, in the analysis for trend through the categories of max-IMT, as max-IMT was increased, the percentage of ≥50% stenosis was increased (P < 0.00005) and the percentage of 0–25% stenosis was decreased (P < 0.0001).

