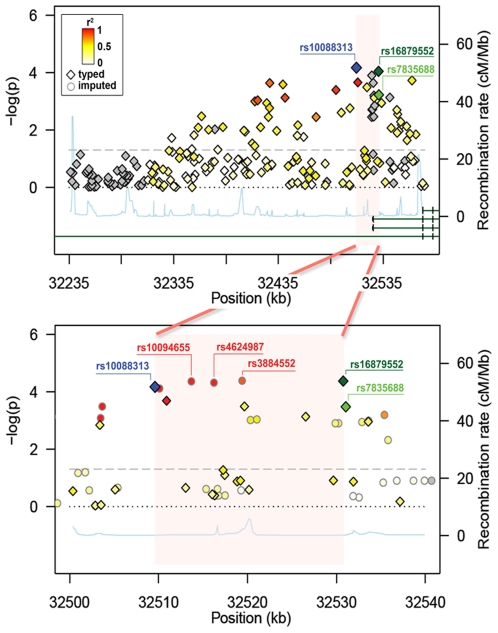
Figure 1. Fine mapping association results of NRG1 SNPs.
Association results shown before (upper panel) and after imputation (lower panel). Diamonds and circles indicate genotyped and imputed SNPs respectively. Colour gradient (red r2 = 1 to white r2 = 0) marks the LD of the SNPs with rs10088313, except green for rs7835688, dark green for rs16879552 and blue for itself; grey indicates no information on LD. The 21 kb region we narrowed down to is highlighted in pink. The fine-scale recombination rate across the region is represented by the light-blue line. Green lines symbolize a schematic representation of the NRG1 isoforms overlapping the associated region. The bottom green line represents the GGF2 isoform associated with schizophrenia that expands 900 kb upstream the transcription start site for the rest of NRG1 isoforms.

