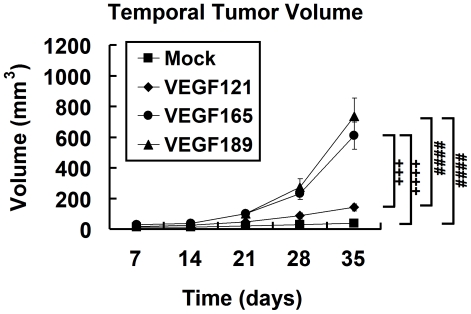
Figure 3. Growth curves of different VEGF isofrom overexpressing tumors and the mock tumors.
Tumor growth of CL1-0 cancer cells overexpressing one of three VEGF isoforms at different time points in SCID mice, estimated using T2WI. #, VEGF189 versus VEGF121 and the mock tumors; +, VEGF165 versus VEGF121 and the mock tumors; *, comparison between different isoform-expressing and mock tumors. Differences between VEGF-overexpressing tumors and mock tumors were significant at the p<0.05 (one symbol), p<0.01 (two symbols), p<0.001 (three symbols), and p<0.0001 (four symbols) levels.

