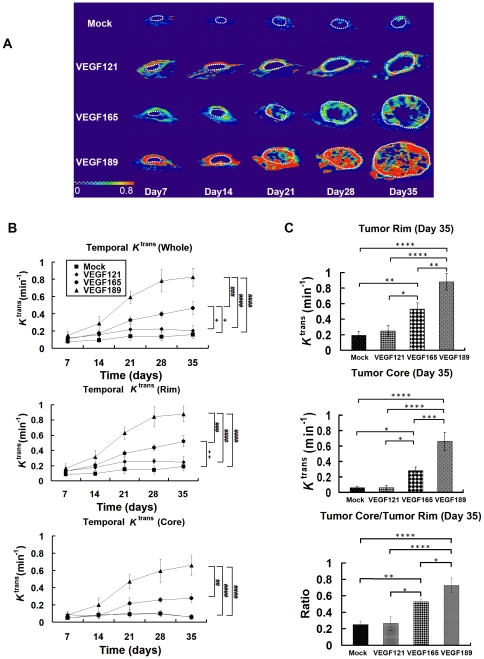
Figure 4. The temporal K trans maps and values of different VEGF isofrom overexpressing tumors and the mock tumors.
In vivo temporal K trans map and quantitative curve for tumor xenografts of CL1-0 cancer cells overexpressing one of three VEGF isoforms at different time points, evaluated by DCE-MRI. (A) Representative K trans color map in the different VEGF-overexpressing and mock-transfected tumors (within dotted circle) at different times, from day 7 to day 35 postimplantation. The color ranged from blue (0/min, lowest K trans) to red (0.8/min, highest K trans). B) Quantitative analysis of K trans values over time in the regions of the whole tumor (upper), tumor rim (middle), and tumor core (lower). #, VEGF189 versus other isoforms and the mock tumors; +, VEGF165 versus VEGF121 and mock tumors. Differences between VEGF-overexpressing tumors and mock tumors were significant at the p<0.05 (one symbol), p<0.01 (two symbols), p<0.001 (three symbols), and p<0.0001 (four symbols) levels. (C) K trans values on day 35 in the tumor rim (upper) and tumor core (middle), and the ratio of K trans values between the tumor core and tumor rim (lower). Differences between VEGF-overexpressing tumors and mock tumors were significant at the *p<0.05, **p<0.01, ***p<0.001, and ****p<0.0001 levels.

