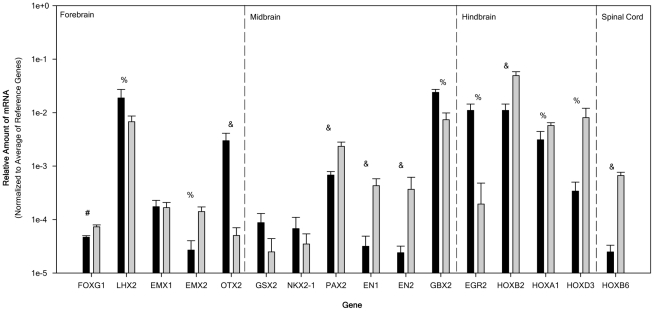
Figure 5. Relative mRNA expression of regional specific transcription factor genes in the rostocaudal direction for NTERA2 (NT2) cells and purified NTERA2 all-trans retinoic acid differentiated neurons (NT2N).
Relative amount of mRNA normalized to the average of 3 reference genes (G3PDH, PPIA, and NUBP1). Relative amounts of mRNA for NT2 (black bar) and NT2N (gray bars) were obtained from 6 passage matched cultures (ranging from 25–36) and all samples were analyzed independently in triplicate. Genes are given from rostral to caudal direction (left to right). Dashed lines divide genes for the forebrain, midbrain, hindbrain, and spinal cord. All data are expressed as the average relative gene expression + SEM. For the comparison of NT2 to NT2N: # p<0.05, % p<0.01, and & p<0.005.

