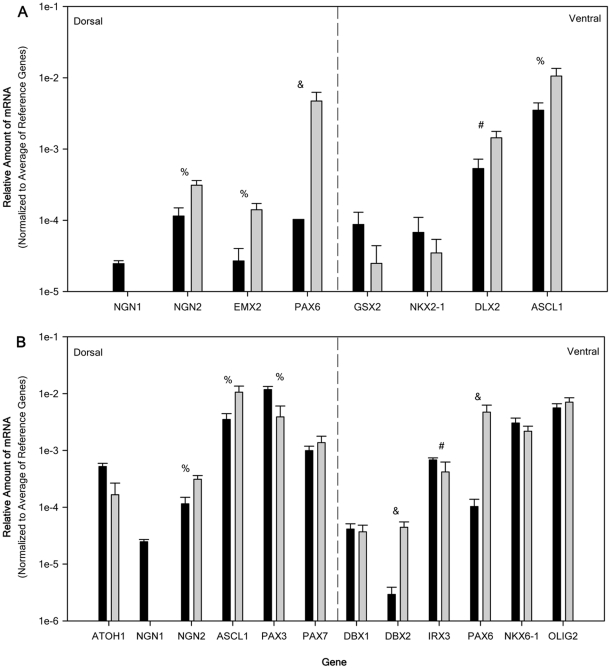
Figure 6. Relative mRNA expression of regional specific transcription factor genes in the dorsoventral direction for NTERA2 (NT2) cells and purified NTERA2 all-trans retinoic acid differentiated neurons (NT2N).
Relative amounts of mRNA normalized to the average of 3 reference genes (G3PDH, PPIA, and NUBP1). Relative amount of mRNA for NT2 (black bar) and NT2N (gray bars) were obtained from 6 passage matched cultures (ranging from 25–36) and all samples were analyzed independently in triplicate. Panel A displays the relative expression from the telencephalon and panel B from the spinal cord in a dorsal to ventral order. Dashed line divide dorsal and ventral genes. All data are expressed as the average relative gene expression + SEM. For the comparison of NT2 to NT2N: # p<0.05, %, p<0.01, and & p<0.005.

