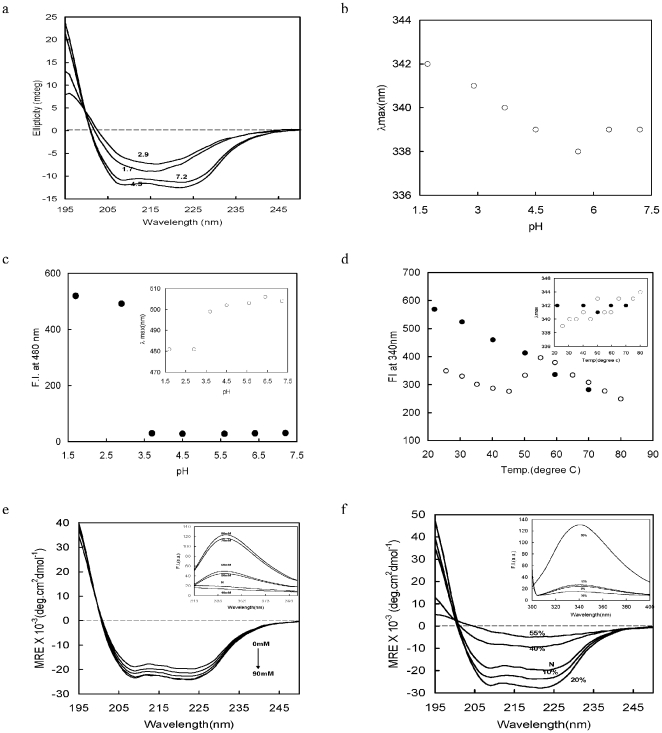
Figure 4. Physico-chemical characterization of PvTRAg33.5.
Far UV CD spectra at different pH (a), emission wavelength at maximum intensity after exciting it at 295 nm as a function of pH (b), fluorescence intensity (filled circle) and emission wavelength at maximum intensity (empty circle) (inset) of ANS-protein complex as a function of pH, after exciting it at 380 nm (c), fluorescence intensities and emission wavelength maxima (inset) after exciting at 295 nm as a function of increase in temperature (empty circle) and consecutive decrease in temperature (filled circle) at pH 7.0 (d), far UV CD spectra and fluorescence intensities (inset) in the absence and presence of different ammonium sulfate concentrations at pH 7.0 after excited at 295 nm (e), and far UV CD spectra and fluorescence intensities (inset) in the absence (N) and presence of different ethanol concentrations after exciting at 295 nm (f) of PvTRAg33.5.

