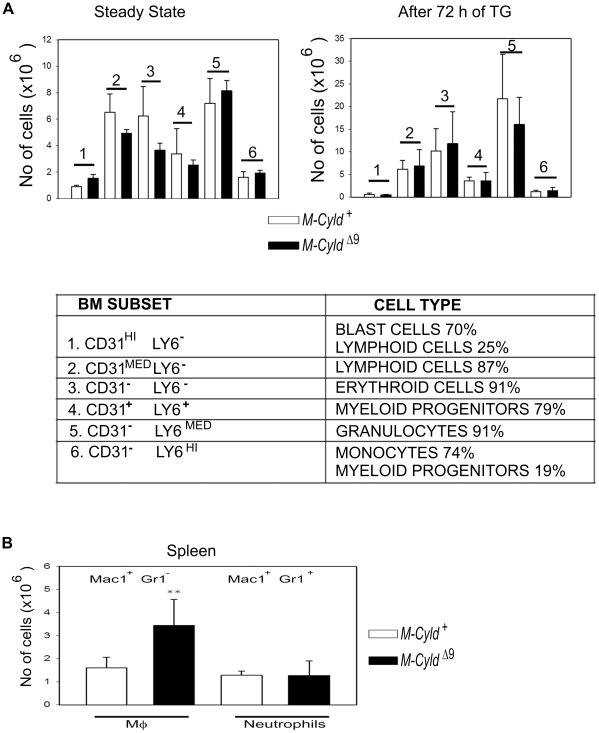
Figure 2. Normal hematopoietic development in M-CyldΔ9 mice.
A) Enumeration of the indicated hematopoietic lineage cells (lower panel) by flow cytometric analysis of bone marrow cells for the expression of Ly6c and CD31 surface markers at steady state conditions (upper left panel) and after 72 h of thioglycollate treatment (upper right panel). In the first case 5 control and 3 M-CyldΔ9 mice were evaluated whereas in the second case 7 control and 5 M-CyldΔ9 mice were evaluated. B) Monocyte lineage populations in spleen. Enumeration of cells in the spleen that were collected from control (M-Cyld+) and mutant (M-CyldΔ9) mice 72 hours after thioglycollate injection. Data are depicted as mean absolute numbers (±SEM) from n = 7 control and 5 M-CyldΔ9 mice at 8 weeks of age. The statistically significant difference in the macrophage populations (Mac1+ Gr1−) of control and mutant mice is depicted by two stars (p<0,001, Student's unpaired t test).

