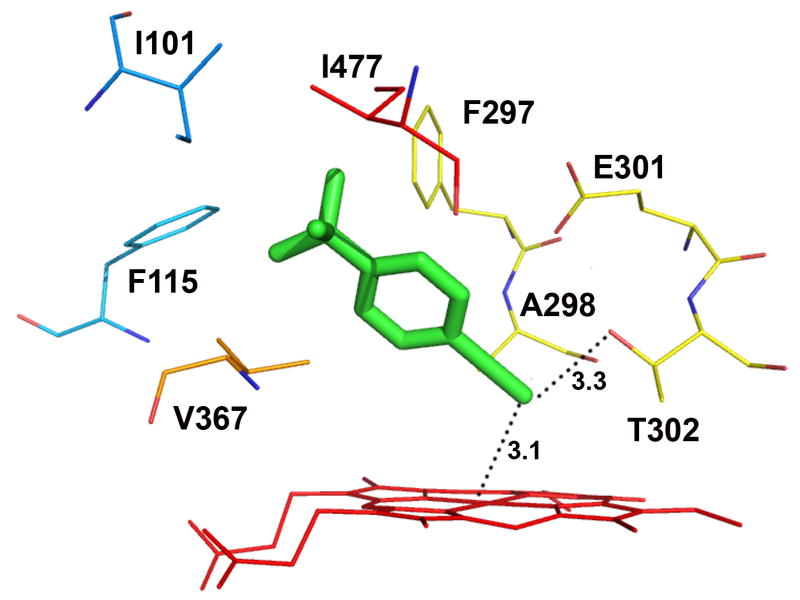
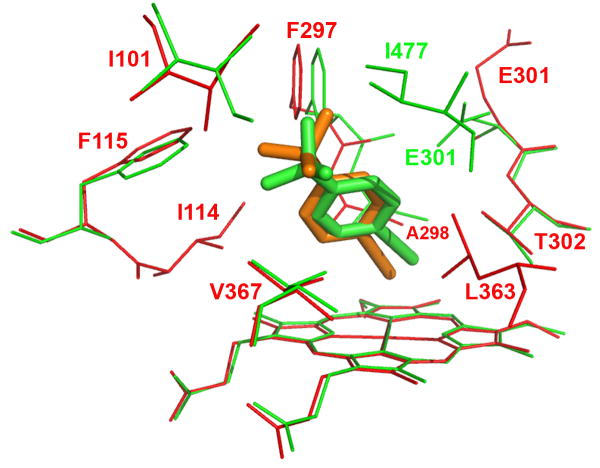
Figure 4.
Molecular modeling showing the lowest-energy pose for tBPA bound in the active site of CYP2B1 (A) and a comparison of tBPA binding in the active site of CYP2B1 with that in CYP2B6 (B). tBPA was docked into the homology model of CYP2B1 and the crystal structure of CYP2B6 using Autodock 4.0 software [53] and the poses with the lowest binding energy are shown. (A) the lowest-energy pose of tBPA in CYP2B1. tBPA is depicted as a green stick and the residues within 4 Å of tBPA are shown as wires; (B). CYP2B1 is superimposed onto CYP2B6 by structural alignment of the Cα of protein backbones of the two proteins. tBPA is depicted in green and orange sticks for CYP2B1 and CYP2B6, respectively. Only the residues within 4 Å of tBPA are shown in wires, green for CYP2B1 and red for CYP2B6.


