Fig. 2.
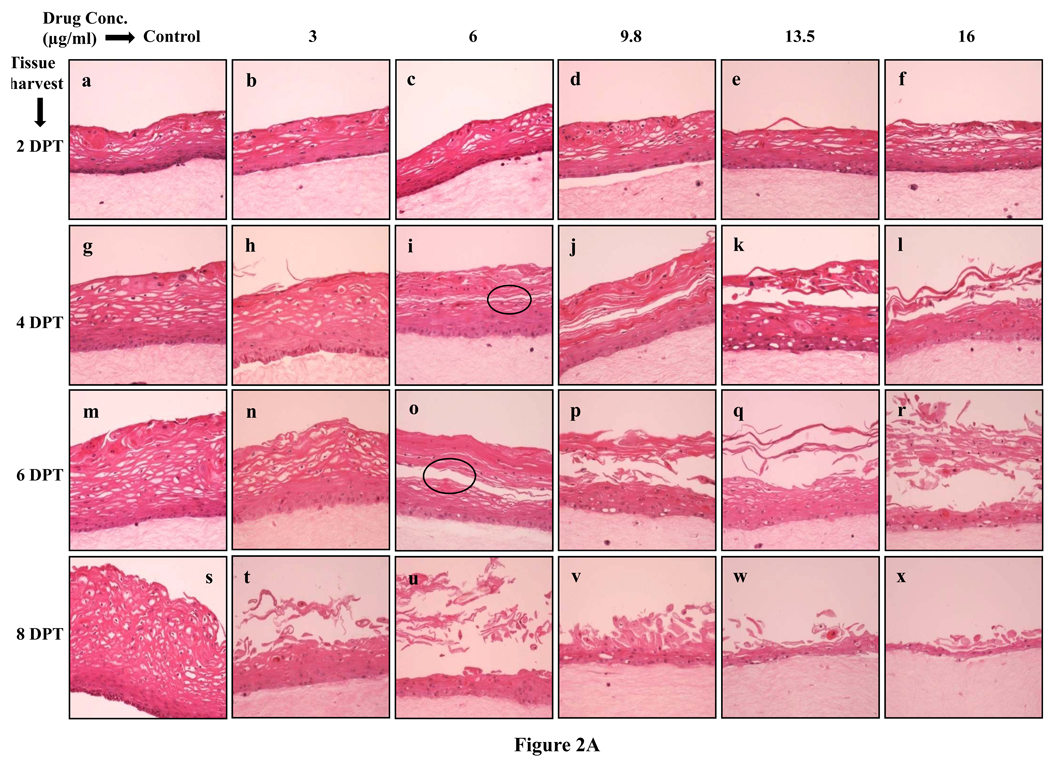
A. Effect of lopinavir/ritonavir on gingival epithelium morphology and stratification. Primary gingival keratinocytes were grown in organotypic (raft) cultures and treated with different concentrations of lopinavir/ritonavir at day 8. (Panels a, g, m, and s) untreated rafts; (Panels b, h, n and t) rafts treated with 3 µg/ml lopinavir/ritonavir; (Panels c, i, o and u) rafts treated with 6 µg/ml lopinavir/ritonavir; (Panels d, j, p and v) rafts treated with 9.8 µg/ml lopinavir/ritonavir; (Panels e, k, q and w) rafts treated with 13.5 µg/ml lopinavir/ritonavir; (Panels f, l, r and x) rafts treated with 16 µg/ml lopinavir/ritonavir. Rafts were harvested at different points and stained with hematoxylin and eosin. (Panels a to f) rafts were harvested at 2 days post treatment; (Panels g to l) rafts were harvested at 4 days post treatment; (Panels m to r) rafts were harvested at 6 days post treatment; (Panels s to x) rafts were harvested at 8 days post treatment. Images are at 20 × original magnification. Circles in images i and o indicate less tight cell-cell contacts within the stratified layers or tissues with compromised integrity.
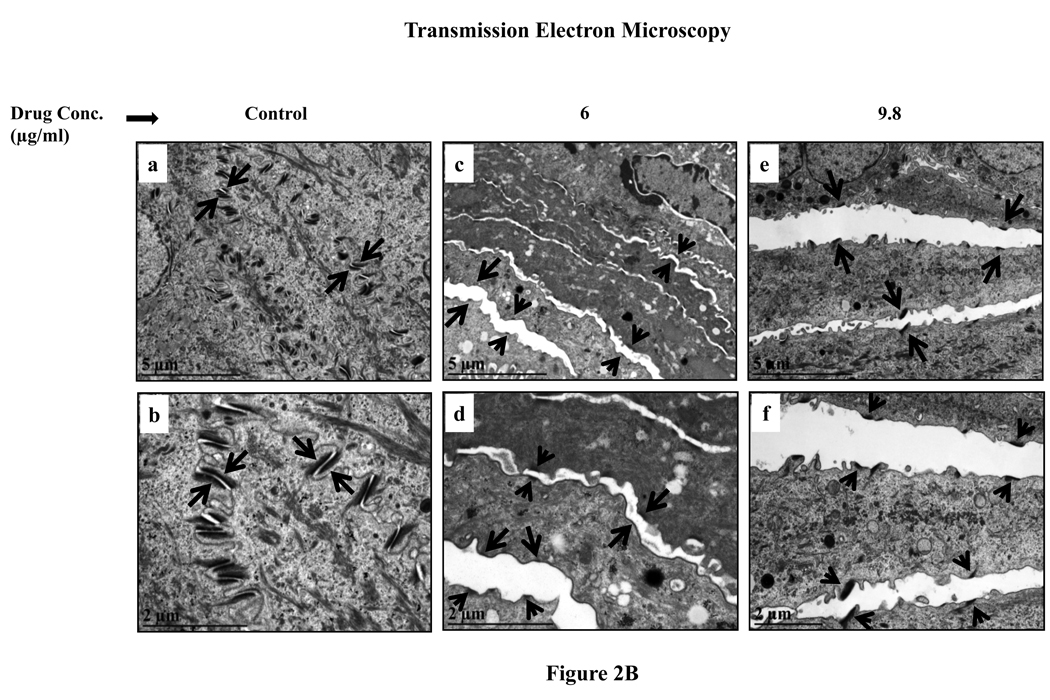
B. Transmission electron microscopy micrographs of untreated and lopinavir/ritonavir treated gingival tissue. (Panels a and b) untreated rafts; (Panels c and d) rafts treated with 6 µg/ml lopinavir/ritonavir; (Panels e and f) rafts treated with 9.8 µg/ml lopinavir/ritonavir. (Panels a, c and e) micrograph at low magnification; (Panels b, d and f) micrograph at higher magnification. Arrows indicate the desmosomes configuration.


