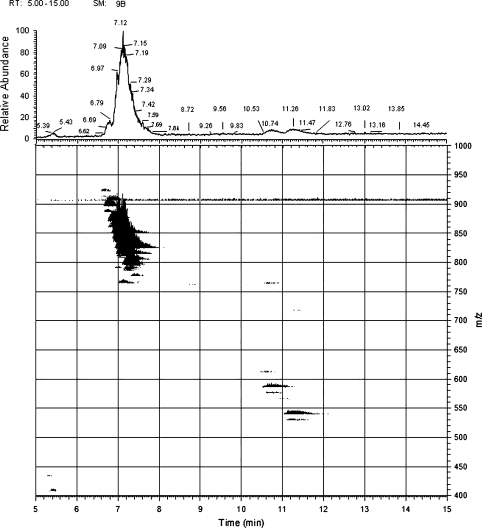
Fig. 1.
Base peak chromatogram and three dimensional (3D) map of phospholipid class separation of krill oil, performed with a linear gradient NPLC/ESI–MS on a HiCHROM LiChrospher 100 DIOL column (250 × 2 mm i.d., 5 μm). MS was operated in the negative ionization mode and set to scan m/z 400–1,000. Only the relevant part of the chromatogram is shown (5–15 min). For the major part of the species, the map show adduct ions in the form of [M + FA–H]−

