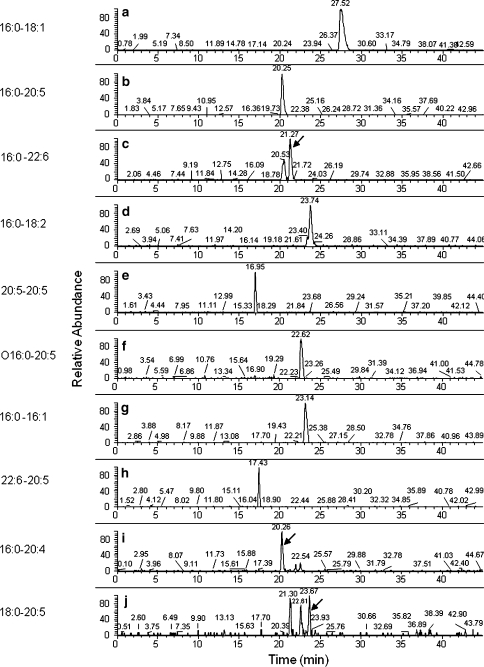
Fig. 4.
Reconstructed ion chromatograms obtained for the 10 species with the highest relative intensities in falling order from a to j. The following m/z values for the adducts [M + FA–H]− were used for the reconstruction: a 804.6 b 824.6 c 850.6 d 802.6 e 870.6 f 810.6 g 776.6 h 896.6 i 826.6 j 852.6

