Figure 1.
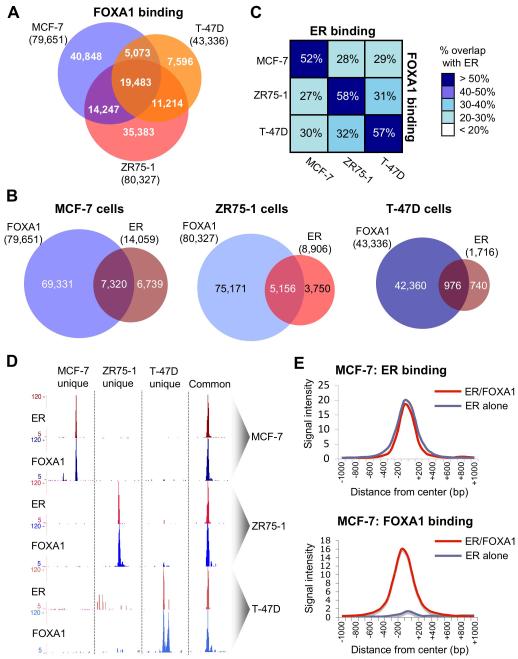
Differential FOXA1 and ER binding overlaps in a cell context manner. A. Overlap in FOXA1 binding events between MCF-7, ZR75-1 and T-47D cells. B. Overlap between ER and FOXA1 in the three ER positive breast cancer cell lines. C. Relative overlap in ER and FOXA1 binding events within and between the three cell lines. The percentages represent the fraction of ER binding events in that cell line. An overlap was considered if the peaks shared at least one base pair. D. Examples of regions showing cell line specific ER and FOXA1 binding. Also shown in an example of a common region bound by ER and FOXA1 in all three cell lines. E. Average signal intensity of ER binding sites that are shared with FOXA1 binding regions or ER binding events that are not shared with FOXA1. The signal intensity of ER binding events that are not shared with FOXA1 are similar to those that overlap with FOXA1. Also included is average signal intensity for FOXA1 binding at these two separate ER binding categories.

