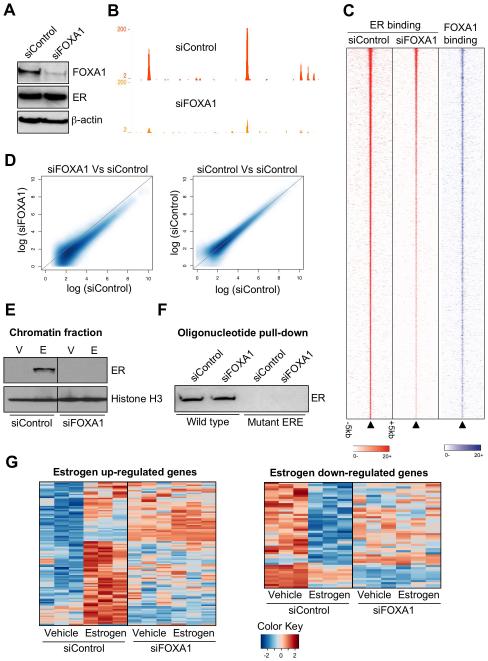
Figure 2.
ER binding to chromatin and transcriptional activity requires FOXA1. A. Western blot of cells transfected with siControl or siFOXA1. B. An example of ER binding in siControl or siFOXA1 transfected cells. C. Heatmap showing the signal intensity of ER binding in siControl or siFOXA1 transfected cells in a window of −/+ 5kb. Also shown in the signal intensity for FOXA1 at the equivalent genomic region. The heatmap represents binding events ranked from the strongest to weakest ER binding (in the siControl condition) and the adjacent columns represent the signal from the corresponding genomic region, but under the different experimental conditions. D. Smoothened scatterplot comparing ER binding intensity in siControl versus siFOXA1 transfected cells. As a control, a scatterplot representing two different siControl experiments is shown. E. Cells were transfected with siControl or siFOXA1, treated with vehicle (V) or estrogen (E) and cells were fractionated to enrich for the chromatin fraction, which was Western blotted. Histone H3 functioned as a loading control. The uncropped Western blot is in Supplementary figure 2. F. Oligonucleotide pulldown using total protein from siControl or siFOXA1 transfected cells. A double stranded biotin labelled oligonucleotide containing a perfect ERE or a mutant sequence was used and protein enriched by the oligonucleotide was Western blotted. G. Gene expression microarray analysis following transfection of siControl or siFOXA1 and treatment with vehicle or estrogen for 6hr.

