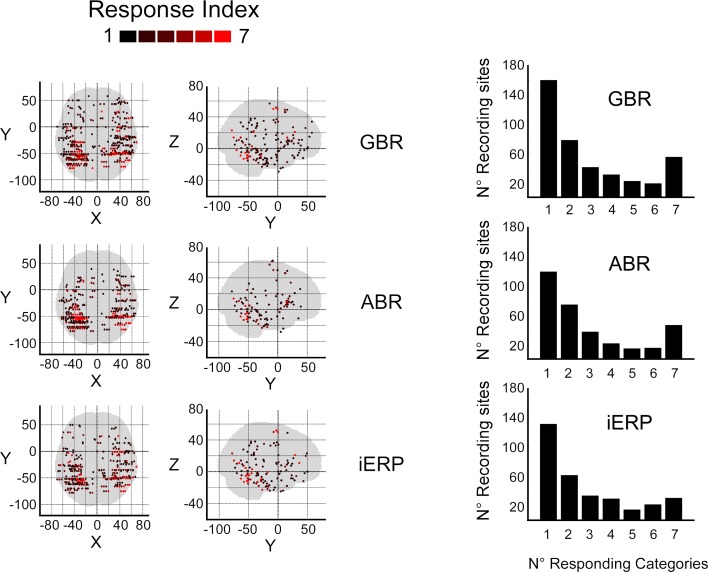
Figure 3.
Response score spatial distributions and histograms. (A) Response index for GBR, ABR, and iERP are plotted according to their spatial location (Wilcoxon test, for all responses, p < 0.05). (B) Histograms show the number of electrode sites that elicit significant responses to visual stimuli.

