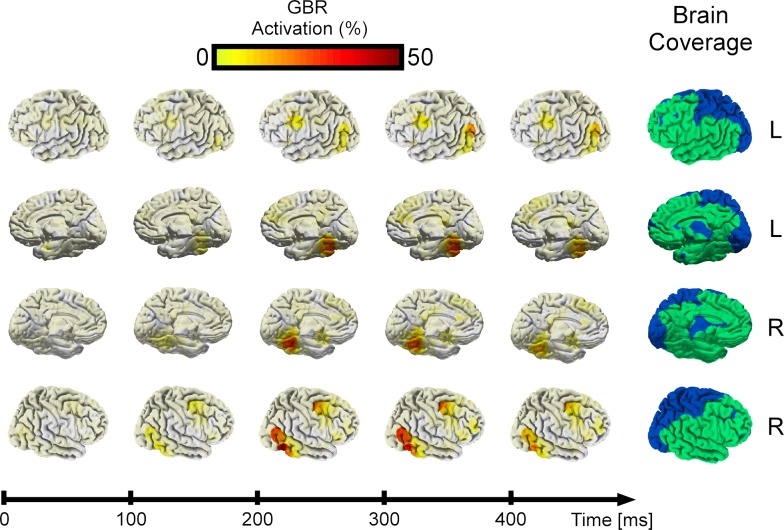
Figure S1.
Global dynamics of GBR across all recording sites (18 patients, 1760 recording sites). After 100 ms post-stimulus, a posterior region in occipital-temporal cortex starts responding. This GBR increases in time until 400 ms, when its starts decaying. A small frontal cluster is also visible. The brain space covered using a 1.5-cm radius inflated sphere around each electrode is shown in green. Frontal and temporal cortex are well-covered, though other regions are sparsely sampled, such as the primary visual cortex and parietal cortex (in blue).

