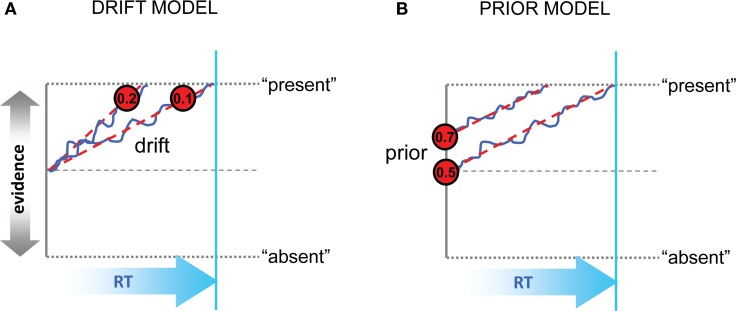
Figure 1.
Schematic representation of the drift and prior models. (A) In the drift model, decisions are biased toward the more valuable option (here, “present”) by increasing the rate of evidence accumulation. Values inside the red circles show representative gain values; blue trace and red dashed trace show evidence accumulation with and without noise. Evidence toward “present” or “absent” is represented on the vertical axis, and time (RT or cycles) on the horizontal axis. The bound is represented with dashed gray lines top and bottom; another dashed line signals the equilibrium point between choices. RT for the slower of the two scenarios is shown with a cyan vertical line. (B) In the prior model, the initial estimates of evidence in favor of the more valuable option are increased, even before the onset of accumulation. Values in the red circles denote possible prior values in units of probability (i.e., p = 0.5 reflects equilibrium between the two choices). Otherwise as (A).

