Figure 2.
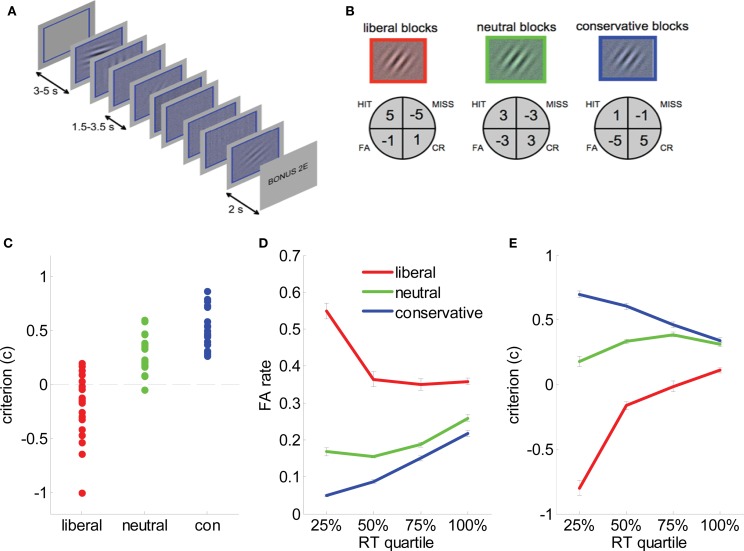
Task and behavioral data. (A) Experimental paradigm. Each block consisted of 8 (or 16 in behavioral sessions) successive presentations of low-contrast Gabor patches in visual noise. A colored frame and tint to the stimulus denoted bias condition (here, blue). Subjects received auditory feedback at the offset of each trial, and each block closed with a bonus screen informing the subject of their winnings/losses. In behavioral sessions on days 1 and 2, subjects additionally received visual feedback in the form of an advancing or receding “payment bar” immediately underneath the stimulus. (B) Payoff matrices for each condition. Subjects received the indicated values for hits, misses, false alarms (FA) and correct rejections (CR). (C) Estimates of criterion (c) for each individual subject in liberal (red dots), neutral (green dots), and conservative (blue dots) blocks. Black dashed line represents c = 0, i.e., no bias. (D) False alarm rate plotted as a function of reaction time quantile for liberal (red lines), neutral (green lines) and conservative (blue lines) blocks. Bars are standard error of the mean (SEM). (E). Criterion (c) plotted as a function of reaction time quantile for liberal (red lines), neutral (green lines), and conservative (blue lines) blocks. Bars are standard error of the mean (SEM).

