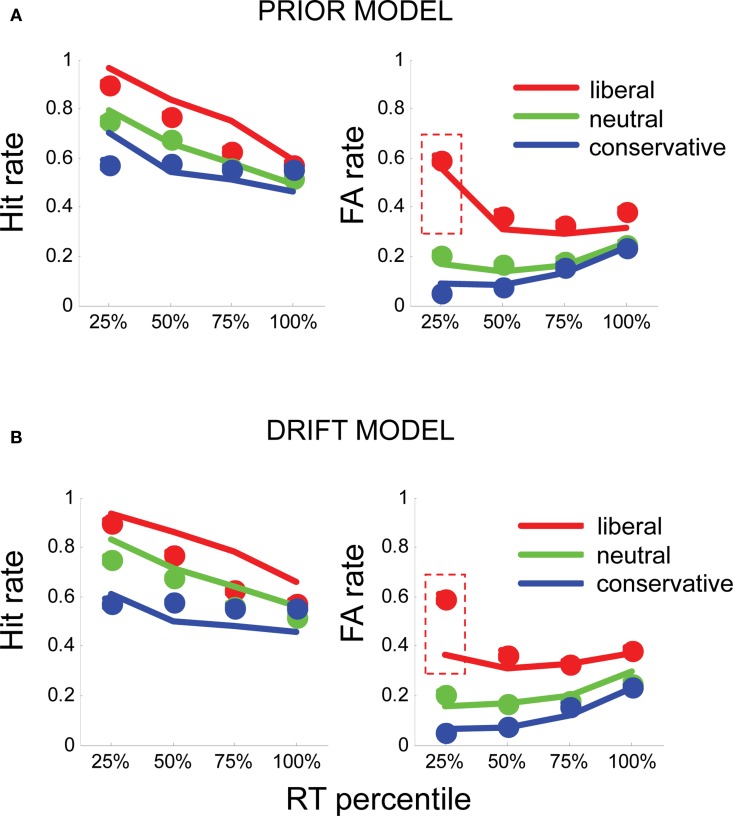
Figure 3.
(A) Fits of the prior model to human hit rates (left panel) and false alarm (FA) rates (right panel), plotted for RT quartiles (fastest 25, 25–50, 50–75, and >75%) in liberal (red), neutral (green), and conservative (blue) conditions. Circles plot the mean of human subject data; lines plot the simulated data from each model variant. (B) Similarly, fits for the drift model (bottom panel) to hit rates and FA rates. Dashed red boxes highlight the fast, liberal false alarms, which are poorly fit by this model.

