Figure 5.
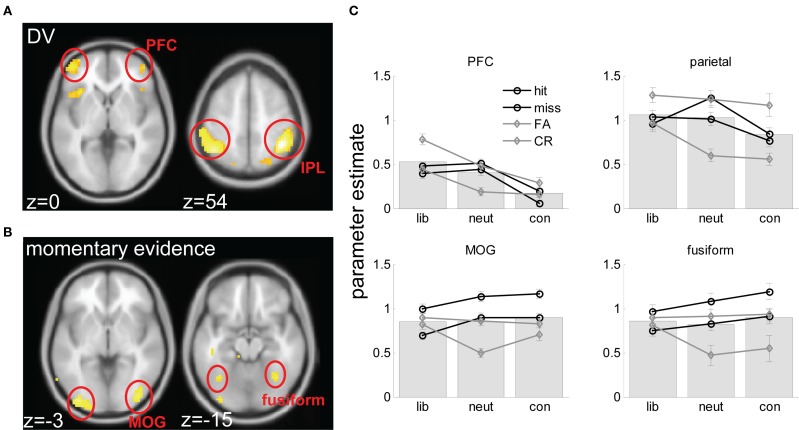
Brain imaging results. (A) axial views of voxels responding to the DV rendered onto a standard brain in the space of the Montreal Neurological Institute (MNI), at an FDR-corrected threshold of p < 0.05. Slices are labeled with their coordinates in the z plane at the bottom left-hand corner. (B) A comparable plot for voxels responding to momentary evidence. (C) Parameter estimates (from factorial ANOVA analyses) for hits, misses, FA and CR trials in liberal, neutral and conservative blocks, averaged across voxels in each of the four clusters (prefrontal cortex – PFC; intraparietal lobule – IPL; middle occipital gyrus – MOG, and fusiform gyrus. Gray lines are for signal absent trials, black lines for signal present trials; full lines for “yes” responses, dashed lines for “no” responses. Underlying bars illustrate mean parameter estimates for liberal, neutral and conservative blocks.

