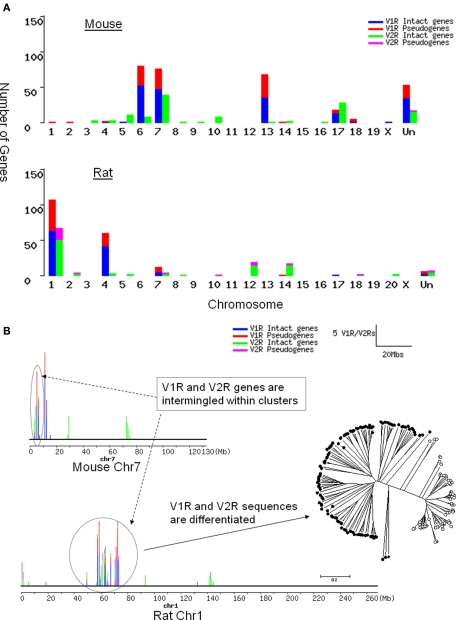
Figure 1.
Chromosomal distribution of rat and mouse V1R/V2R genes. Blue, intact V1R genes; red, V1R pseudogenes; green, intact V2R TMs; purple, V2R pseudo-TMs. (A) The number of OR/V1R genes on each chromosome of mouse (top) and rat (bottom). “Un” represents the sequences unmapped in current mm5 and rn3 assembly. Even though there are fewer V2Rs than V1Rs in rodents, V2R genes are dispersed on more chromosomes than V1Rs. (B) V1R and V2R genes are intermingled with each other in clusters, which does not occur between VRs and ORs. The number of V1R/V2R genes per 1 Mb is shown as bars on each chromosome. The height of each bar is proportional to the number of genes in that locus. Rat chromosome 1 and mouse chromosome 7 are drawn according to the rn3 and mm5 assembly respectively. The number of V1R/V2R genes per 1 Mb is shown as bars on each chromosome. The ellipse and circle in dotted line are drawn to point out the cluster with intermingled V1Rs and V2Rs. Phylogenetic tree with VRs in the circled cluster on rat chromosome 1 was drawn to illustrate that their sequences are still differentiated clearly as V1R or V2Rs, even though their genomic locations are intermingled.

