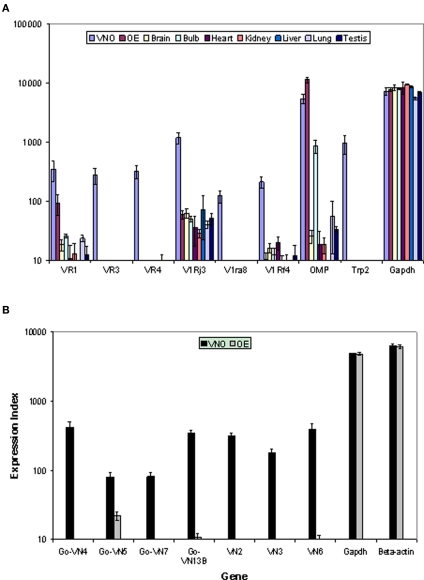
Figure 2.
Validation of the custom array by examining differential gene expression for control and vomeronasal receptor genes across tissues in mouse (A) and rat (B). The mean expression values and standard errors are shown with sample numbers n = 5 for OE and VNO, n = 3 for other tissues. Control genes show expression profiles consistent with known data. Receptor genes show clear differential expression in the appropriate olfactory tissue despite the relatively low signal levels.

