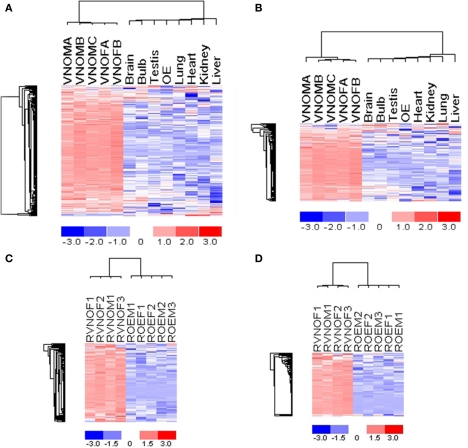
Figure 3.
Expression profiles of V1R genes and V2R genes across tissues, showing VNO-specific expression of mouse V1R genes (A) and V2R genes (B), rat V1R genes (C) and V2R genes (D). All tissues are from 2-month-old adult mice. For OE and VNO tissues, the suffix “M” or “F” denotes that the tissue was from male or female animals, respectively. The gene expression values are standardized such that the mean is 0 and standard deviation is 1 for each gene. The color represents expression values as shown in the scale bar, with red corresponding to higher-than-mean expression values and blue corresponding to lower-than-mean values. The dendrogram on the left shows clustering of genes, and the top dendrogram shows clustering of samples based on the expression data. Genes with at least two present calls and high variation across samples are chosen for the clustering analysis and are shown in the figure. In (A), 179 probe sets representing 168 mouse V1R genes are shown; in (B), 107 probe sets representing 98 mouse V1R genes are shown; in (C), 108 probe sets representing 108 rat V1R genes are shown; in (D), 87 probe sets representing 87 rat V2R genes are shown.

