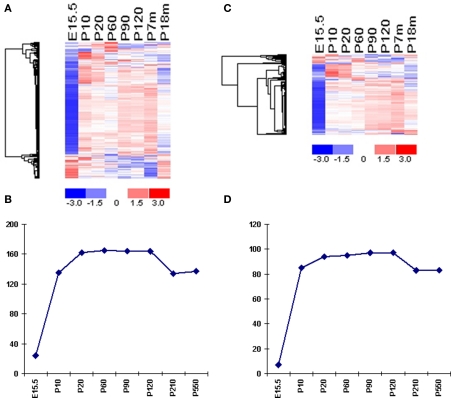
Figure 4.
Temporal expression of VR genes. (A) Expression profiles of mouse V1R genes from different ages are plotted in the same manner as in Figure 2. Samples are listed according to the age, and genes are shown according to the clustering result. One sample per time point is used in this analysis. Mean of the expression values at each time pointed were used for clustering. One representative probe set was used for each VR gene. In total, 168 probe sets representing 168 mouse V1R genes are shown. (B) The numbers of expressed mouse V1R genes (using OE as background) during different stages. (C) Expression profiles of mouse V2R genes from different ages are plotted in the same manner as in Figure 2. (D) The numbers of expressed mouse V2R genes (using OE as background) during different stages.

