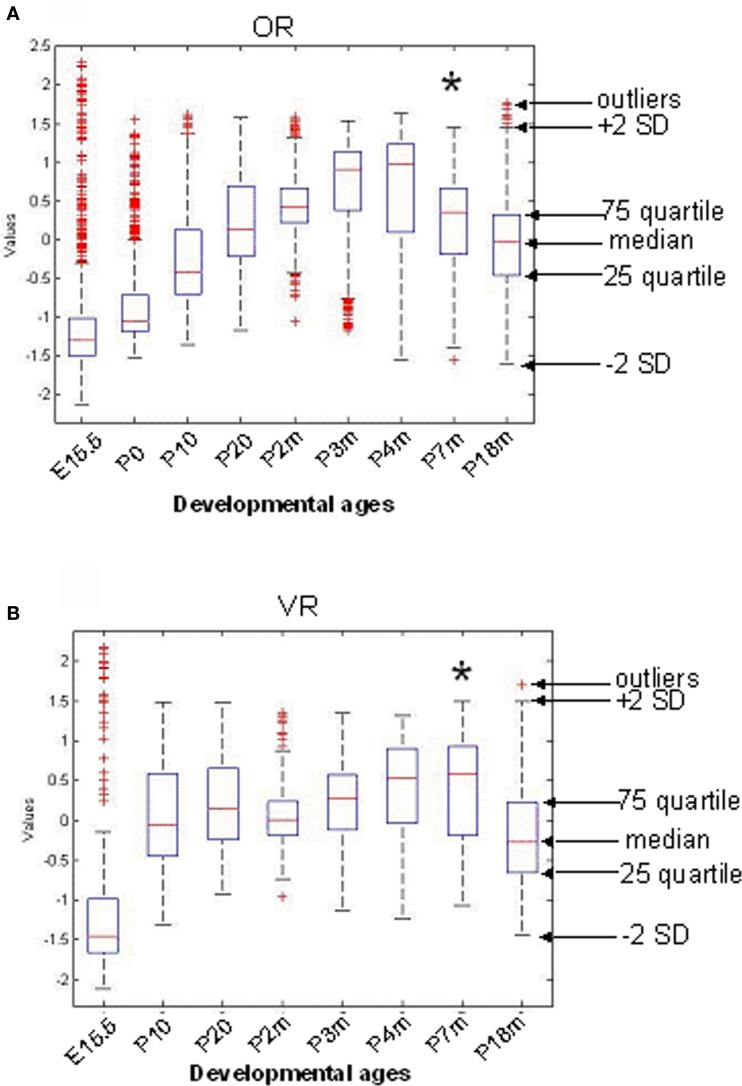
Figure S2.
Overall Time course of Expression Level Change of All OR (A) and VR (B) Genes. The median, 25th quartile, 75th quartile and standard deviation were measured for the expression level of all 845 ORs (A) and 236 VRs (B) at each time point, and shown in the box plots. (A) Even though there are outliers, the median expression level for OR genes was low at embryonic age 15.5 and increased during maturation. The peak was reached at 3–4 months, followed by a drop at 7 months and a continuous decrease through 18 months. (B) The overall expression level for VR genes was low at embryonic age 15.5, but was remarkably elevated before P10 (less than 2 weeks time). The median level decreased between 7 and 18 months. Compared to ORs, the expression level change for VRs between P10 and P7m was more marginal; and the expression level decrease for VRs occurred later than ORs. Their differences in temporal expression patterns may be due in part to their distinct functions in detecting environmental chemicals versus social signals, necessitating variant expression levels at distinct developmental ages.

