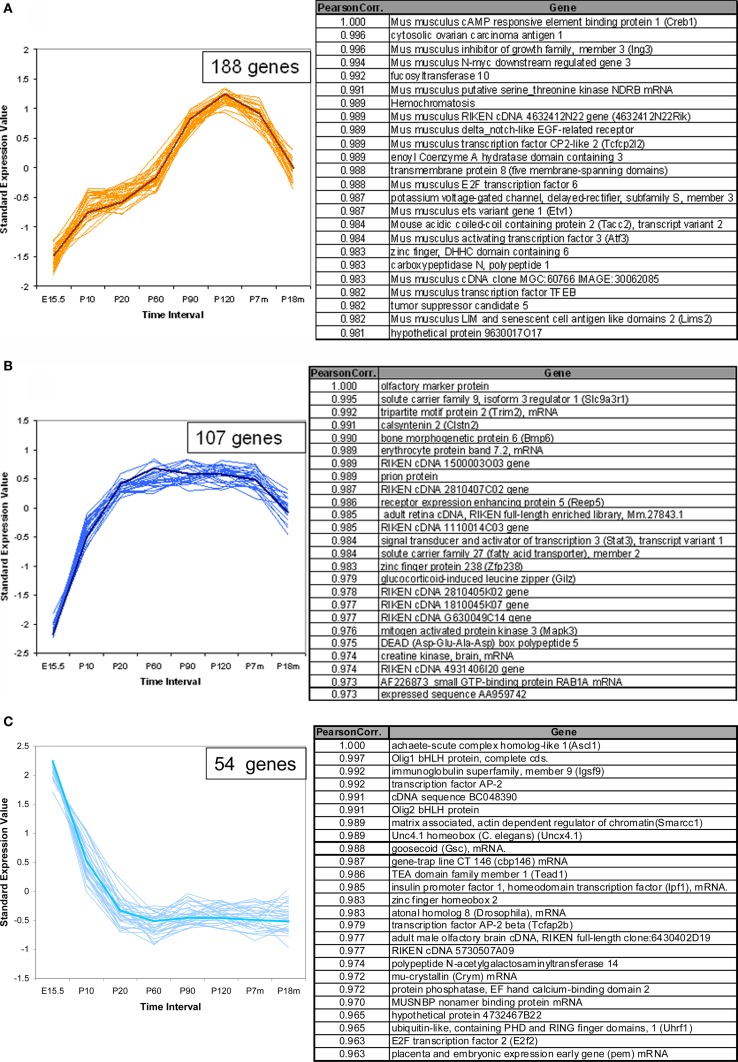
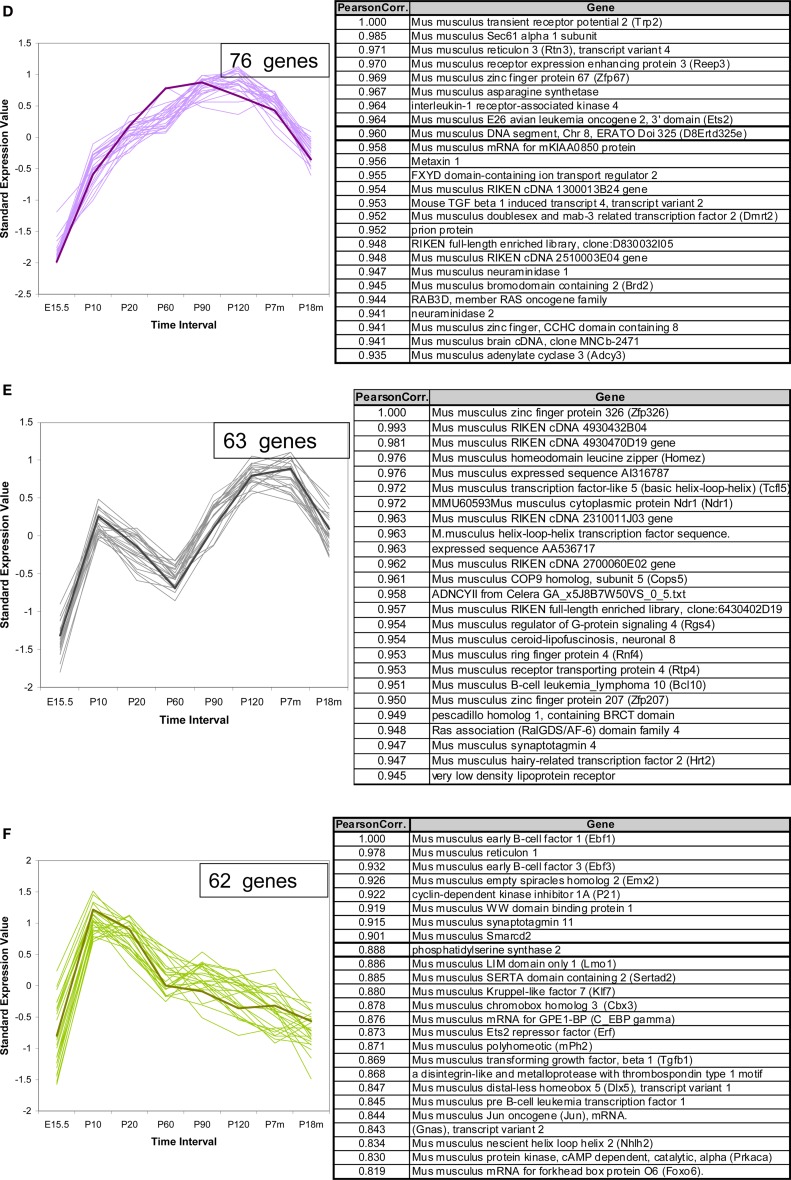
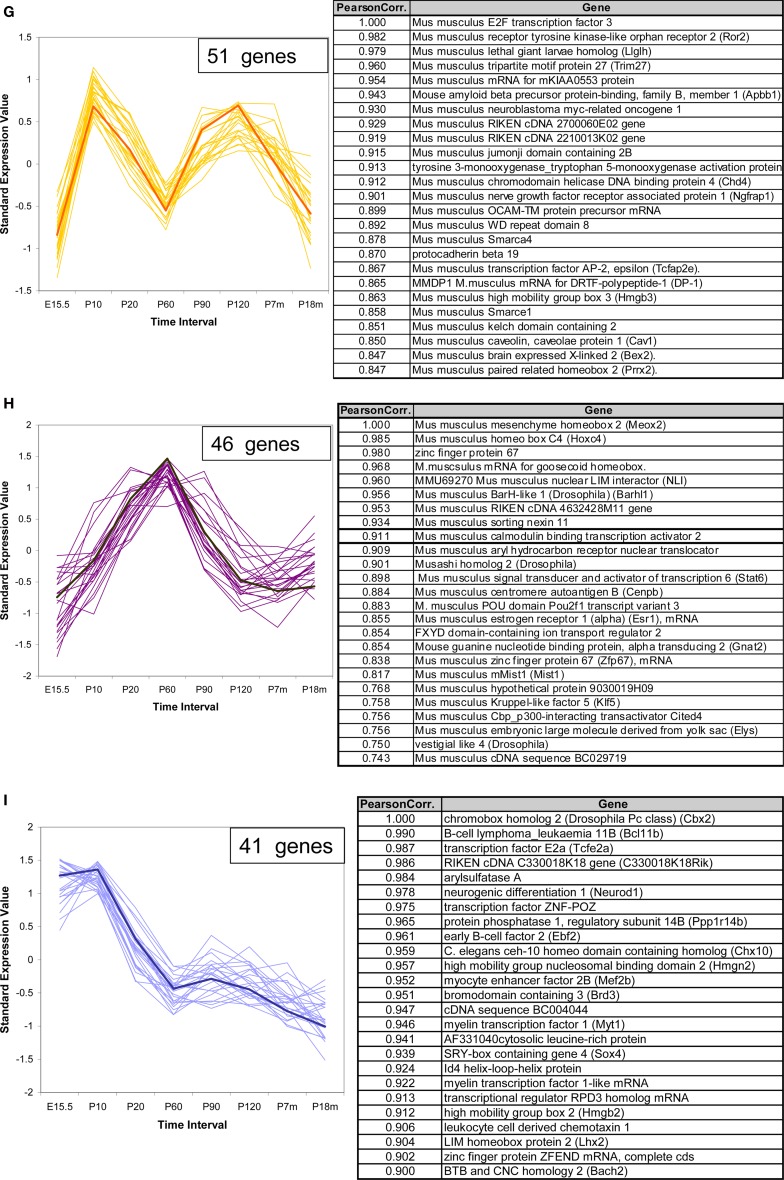
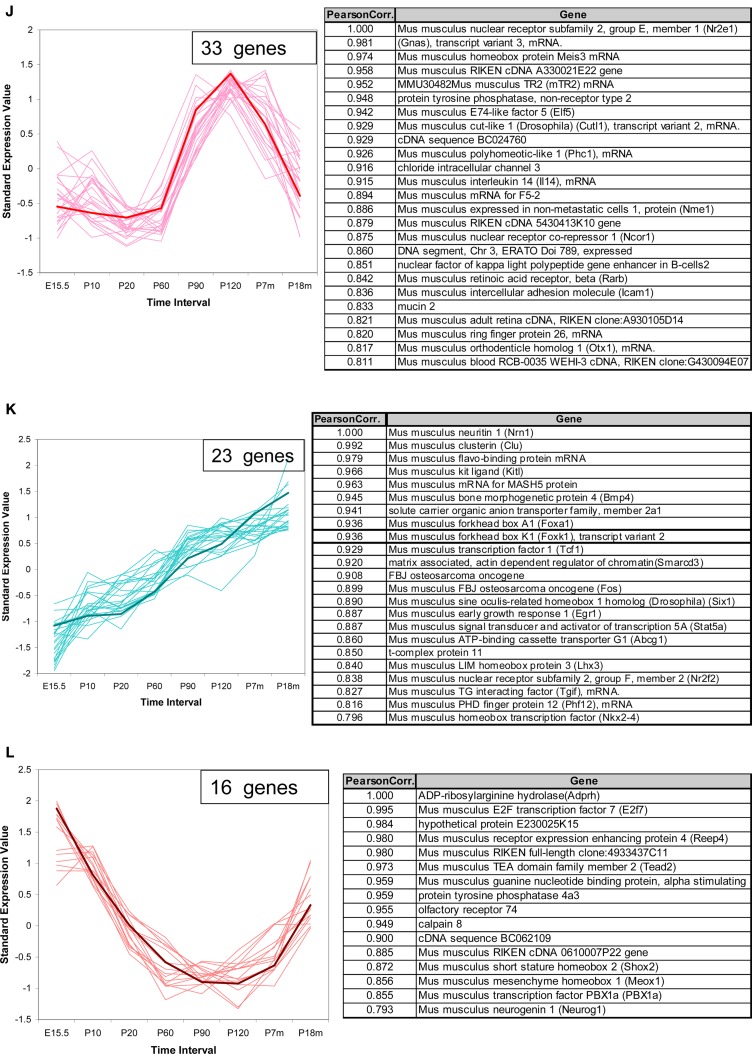
Figure S3.
Temporal expression patterns for non-receptor genes of interest. The expression pattern of 1340 non-VR genes in the VNO were analyzed. Seven hundred sixty out of them showed significantly different expression levels over the animal's lifetime, and were classified into 12 patterns (A–L). The top 25, or all genes if there are less than 25, in the pattern were selected to draw the figures and the specific gene information is listed in the corresponding tables. A representative gene, which was selected based on the correlation to the average trend over time, is highlighted in the weighted line. The number of genes in each pattern is given in the box in the upper-left corner. The patterns are ordered in terms of the number of genes in the pattern except pattern (C). In the table, the genes were ordered according to their correlation with the representative genes.


