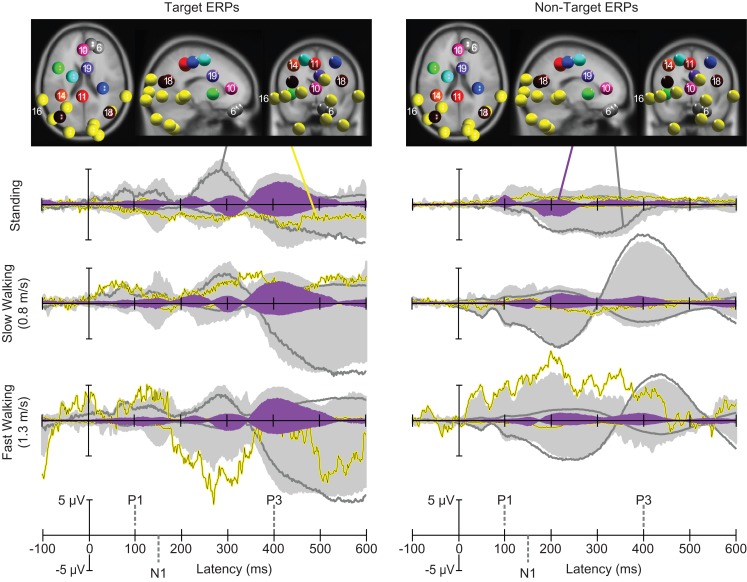
Figure 4.
Centroids of IC clusters (colored spheres) visualized in the MNI brain volume in horizontal, sagittal, and coronal views. Gray and yellow spheres represent eye and neck muscle activity clusters, respectively. Other-colored spheres mark centroids of brain IC clusters. Traces display grand-mean ERP envelopes (maximum and minimum channel ERP values at each latency) summing back-projections of all IC clusters (light gray areas), envelopes of one representative neck muscle cluster (Cluster 16, yellow traces) and a representative eye movement cluster (Cluster 6, dark gray traces). Filled purple envelopes show the back-projected contribution of one IC cluster (19) with equivalent dipoles in or near anterior cingulate cortex. Left column: visual target stimulus responses in the three movement conditions. Right column: non-target stimulus responses.

