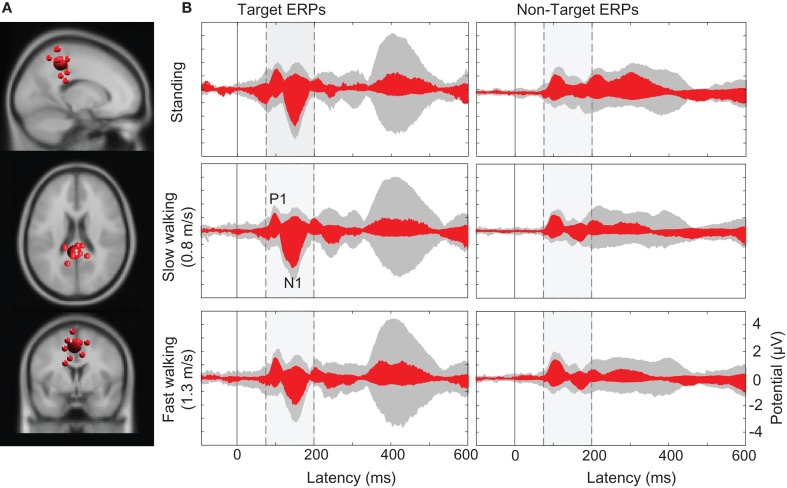
Figure 7.
(A) Centroid (bigger sphere) and individual ICs (12 ICs from 10 subjects displayed as smaller spheres) in or near superior parietal cortex (BA7) projected onto the standard MNI brain volume. (B) Target and non-target stimulus ERPs (middle and right columns) in the (dashed/shaded) P1-N1 latency range. Gray-shaded “ERP envelopes” tightly enclose the bundle of spatially filtered scalp channel ERP traces at each latency. Red-filled envelopes outline the ERP contributions of the IC cluster contributing most strongly to the “ERP envelopes.”

