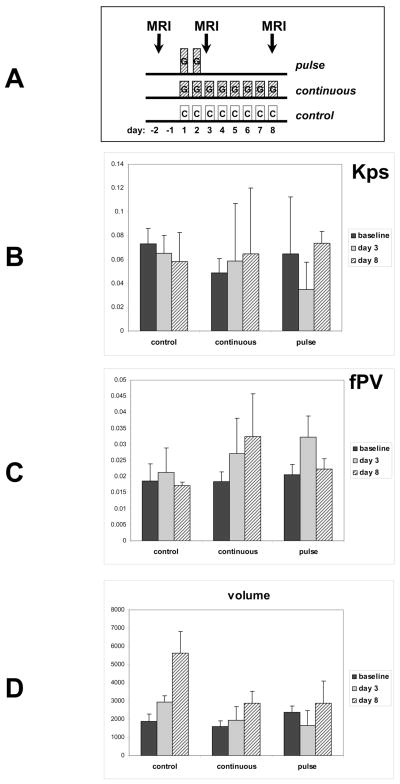
Figure 3.
Mice bearing BT474 tumors of approximately equal size were treated according to 3 treatment arms. A) A schematic displaying the treatments administered in the three arms. The pulse-treatment arm consisted of 6 mice receiving gefitinib for only two days at 1000 mg/kg/day. The continuous-treatment arm consisted of 6 mice receiving gefitinib daily at 150 mg/kg/day. The control arm consisted of four mice receiving vehicle by oral gavage. All mice underwent DCE-MRI studies at baseline and on day 3 and on day 8 as depicted. B) Transendothelial permeability (Kps) values were calculated for each of the three treatment arms at the three studied timepoints. Y axis reflects Kps in ml/100g/min. B) Fractional plasma volume (fPV) was calculated for each of the three treatment arms at the three studied timepoints. Y axis reflects fPV as a fraction of 1. C) Tumor volume in voxel numbers is shown for each of the three treatment arms at the three studied timepoints. Error bars; SD.

