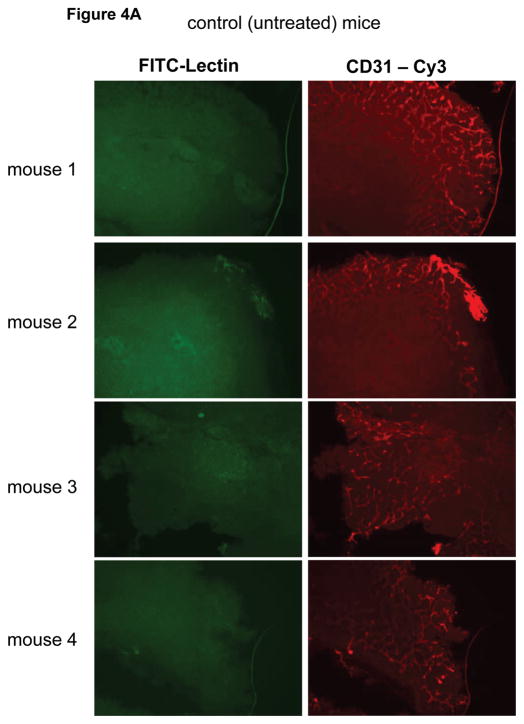
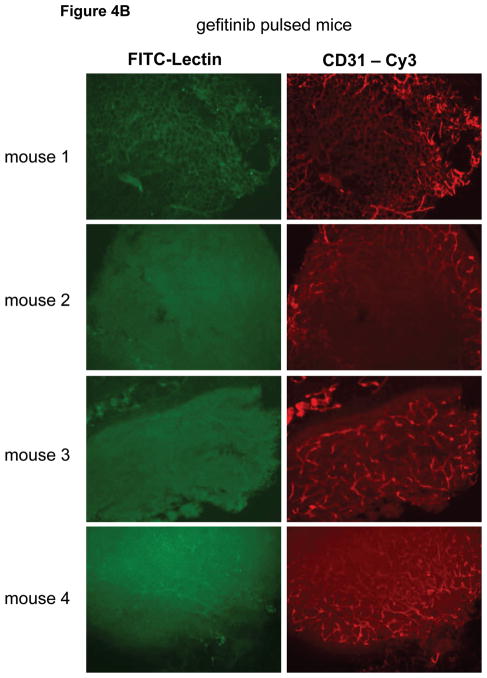
Figure 4.
Eight mice bearing BT474 tumors of approximately equal size were divided into two groups and treated with 1000 mg/kg gefitinib for two days or control gavage and on the third day the tumor vasculature was studied by lectin-perfusion in vivo staining and by anti-CD31 immunostaining of tumor sections as described in methods. Lectin perfusion staining is in green; anti-CD31 staining is in red.


