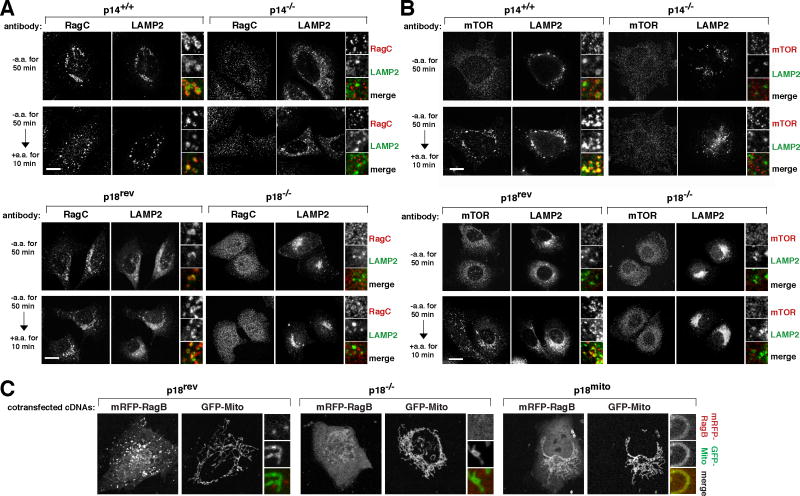
Figure 3. The Ragulator is necessary to localize the Rag GTPases and mTORC1 to lysosomal membranes.
(A) Images of p14-null or p18-null cells or their respective controls co-immunostained for RagC (red) and LAMP2 (green). Cells were starved of and restimulated with amino acids for the indicated times before processing for the immunofluorescence assay and imaging.
(B) Images of p14-null or p18-null cells or their respective controls co-immunostained for mTOR (red) and LAMP2 (green). Cells were treated and processed as in (A).
(C) Co-localization of mRFP-RagB (red) with GFP-Mito (green) in cells expressing mitochondrially-localized p18. p18-null cells (p18−/−), or p18-null cells expressing wild type p18 (p18rev) or mitochondrially-localized p18 (p18mito), were transiently transfected with the indicated cDNAs in expression plasmids and imaged. In all images, insets show selected fields that were magnified five times and their overlays. Scale bar is 10 μm.
See also Fig S3.

