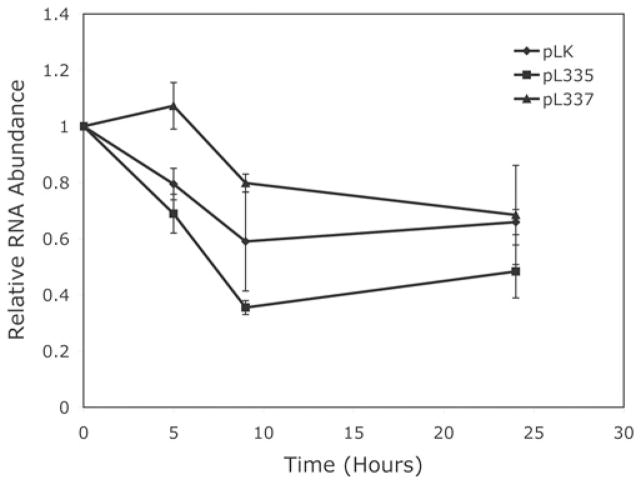
Figure 8. Changes over time of relative tropoelastin mRNA abundance in fibroblasts infected with control pLK virus or fibulin-4 shRNA viruses pL335 and pL337.
The rate of tropoelastin mRNA degradation in pL335- or pL337-infected fibroblasts was not significantly different from that in pLK-infected cells as determined by Student’s t test. Results are means ± S.D. for five to eight samples.

