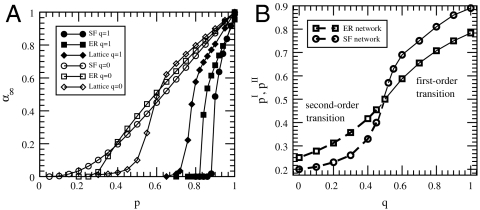
Fig. 2.
(A) Simulation results showing the first- and second-order phase transitions in lattice, ER, and SF networks. The fraction of nodes in the giant component at the end the cascade process, α∞, is shown as a function of p for q = 1 (filled symbols) and for q = 0 (open symbols), where q is the fraction of dependent nodes. For q = 1, α∞ abruptly drops to zero at the transition point, characterizing a first-order transition. For q = 0, α∞ gradually approaches zero as expected in a second-order transition. The SF (circle) and ER (square) networks presented both have the same average degree of 〈k〉 = 3.5. Thus, SF networks that are most robust when only connectivity links exist (very low transition point for q = 0) become most vulnerable when dependency links are added (very high transition point for q = 1). (B) The transition points, pI for the first-order region (solid line) and pII for the second-order region (dashed line) are plotted as a function of q (the fraction of dependent nodes) for ER (squares) and SF (circles) networks with the same average degree 〈k〉 = 4. For ER networks theoretical results (confirmed by simulation results) are obtained according to Eqs. 3 and 4 presented in the paper. For SF networks simulation results of a network with λ = 2.9 are presented because exact theoretical results are not available.

