Fig. 3.
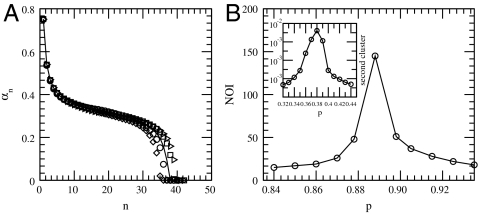
(A) Comparison between simulations and theoretical results for the fraction of nodes in the giant cluster on every step n of the iterative process of failing nodes. The results are shown for an ER network with q = 0.8 and p = 0.84 (p ≃ pI). The theoretical results (line) are calculated according to Eq. 1 [the explicit form of g(x) is presented in the text] and are compared to several realizations of computer simulations on networks of size N = 200 K. (B) The number of iterative failures (NOI) are shown for a scale free network with λ = 2.7 and q = 1. At the first-order transition point, the number of iterative failures that the network undergoes before disintegrating scales as N1/4 (see SI Text). This number sharply drops as the distance from the transition is increased. Thus, plotting the number of iterations as a function of p provides a useful method for identifying the transition point, pI, at the first-order region. The inset shows that the size of the second largest cluster reaches its maximum value at the second-order transition point, pII, therefore providing a useful method for identifying pII at the second-order region.

